## Installation
```
brew install youplot
```
```
gem install youplot
```
```
nix shell nixpkgs#youplot
```
```
guix install youplot
```
```
conda install -c conda-forge ruby
conda install -c conda-forge compilers
gem install youplot
```
## Quick Start


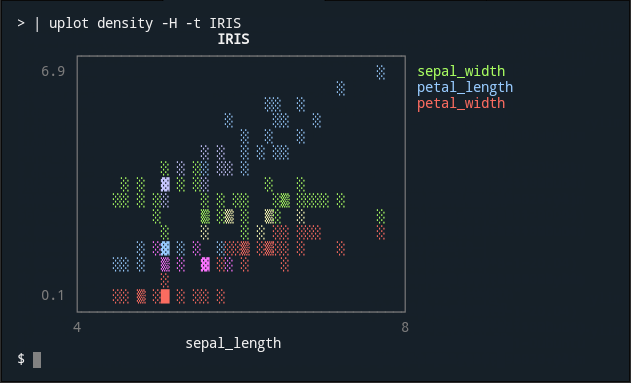
 `uplot
